Things have been awfully quiet here for the past few months. Lots of other side projects have been taking up my time lately and I haven't felt the need to blog much. I have been doing a lot of reading and writing though and I will hopefully write something about all that stuff soon. For now though, I thought I'd talk about a little side project I've had running for the last half-year.
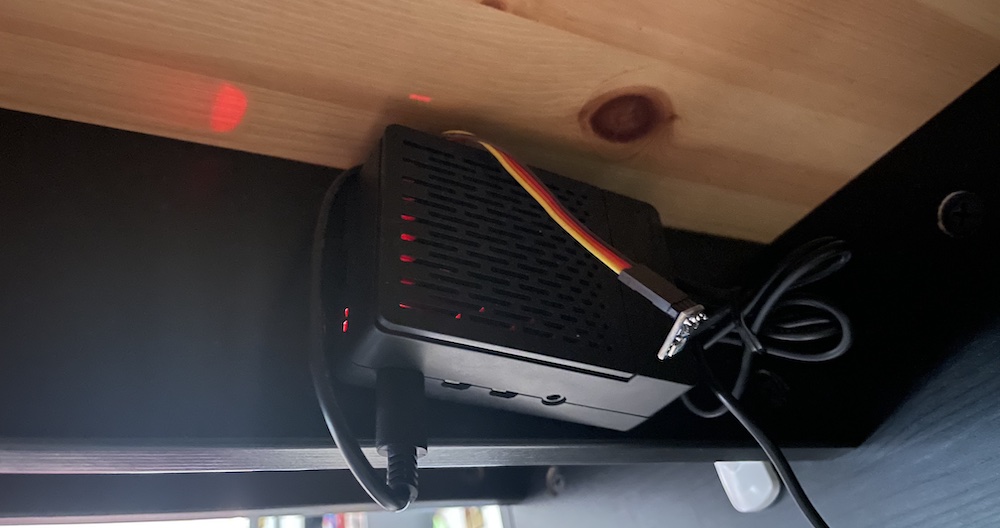
I have a Raspberry Pi bolted to the bottom of my desk. It's name is Demin1 and it does all kinds of useful things for me. One of those things is collecting the current ambient temperature and atmospheric pressure in the room. Originally I intended to chart this data and see if it correlates with me having random headaches. I'd always heard that pressure changes can cause headaches, but I'd never tested the theory myself. Luckily (and unluckily) my headache sample-set this year is far too small to use to reasonably answer this question, but that doesn't mean that Demin's work is all for naught!

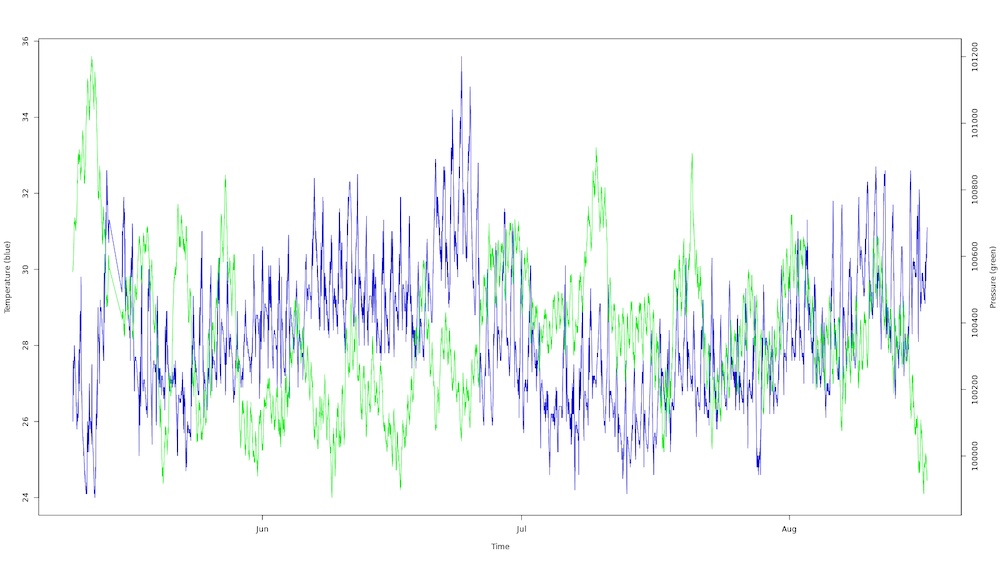
Using a mixture of R, Python, bash, and a SQLite database I've been recording, tracking, and publishing this data for the past several months on an personal website on my local network. But since the data is very cool looking, I figured I'd post the full chart here. I've also uploaded a gist of the code I use to collect the sensor measurements. The script has a small bash wrapper script that is run via cron job which collects new measurements every five minutes. I've also set up a CGI script (yeah really) that allows me to see the most recent measurements from any device on my local network.

As I've said before, I love doing the odd bit of scripting to automate menial work. I could have just bought a small indoor weather station, but that wouldn't provide me with programatic access to either real-time or historical data. Plus putting this whole thing together was half the fun anyway.
